St. Helens
« Change locationThe diagram below gives you a snapshot of St. Helens. Each leaf represents how your area is performing on different topics, like energy and nature. Click or tap on one of the leaves to see more detail.
Unsure where to start? We’ve made some suggestions below on areas to focus on first in St. Helens, but feel free to skip straight to whatever topic chimes with you.
Click or tap one of the leaves to see more detail
St. Helens's performance on energy is calculated using data related to renewable energy generation, fossil fuel investment and heat pumps in the area.
St. Helens's performance on homes is based on data related to home insulation, eco-heating systems and recycling rates.
St. Helens's performance on transport is based on data related to cycling rates and commutes made by low-carbon options.
St. Helens's performance on nature is based on data related to woodland cover in the area, and access to green space.
St. Helens's performance on health is based on data related to meat and dairy consumption, access to green space, and levels of fuel poverty in the area.
Key stats from St. Helens
How to reduce emissions in St. Helens
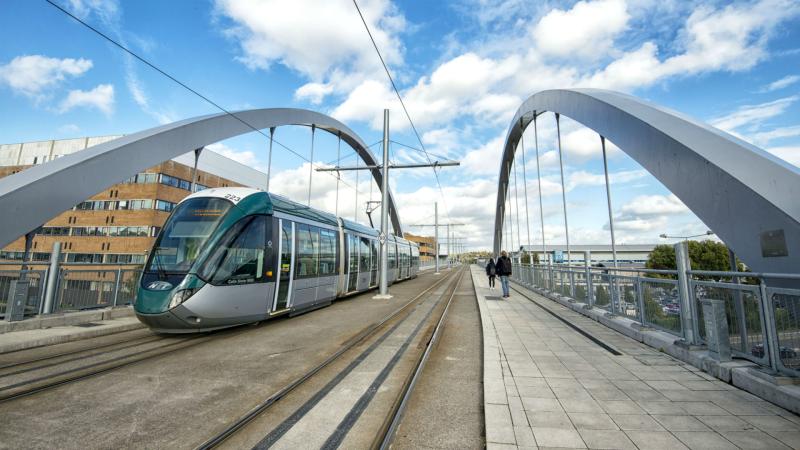
Improve transport
According to government data, transport is responsible for 22% of St. Helens's climate-wrecking emissions.
Local authorities need to do all they can to encourage residents to travel by cycling, e-bikes and walking, as well as public transport, in order to lower emissions and improve air quality.
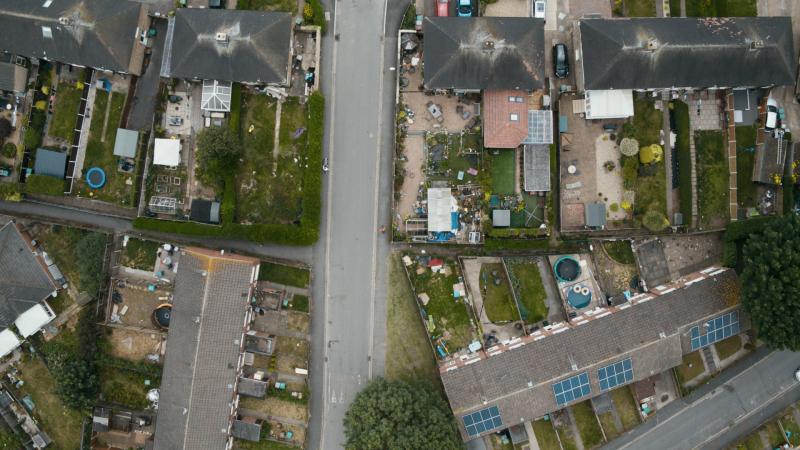
Fix homes
According to government data, problems with St. Helens’s housing sector are responsible for 32% of the area’s emissions.
Making sure every home is insulated and providing grants for more climate-friendly heating could help lower energy bills and reduce emissions. What's more, it could ease the struggles many households now face because of the rising cost of living.
Prioritise renewable energy
According to government data, St. Helens gets nearly all its energy from climate-wrecking fossil fuels.
That’s why we recommend prioritising renewable energy, which is key to reducing emissions from transport and making home heating cheaper and more efficient.

Fix homes
Data also shows that poorly heated homes and issues with waste disposal in St. Helens means that the housing sector is more polluting than it needs to be.
Making sure every home is insulated and providing grants for more climate-friendly heating could help lower energy bills and reduce emissions. What's more, it could ease the struggles many households now face because of the rising cost of living.
Find out more
Improve transport
Data also shows that transport is responsible for 22% of St. Helens's climate-wrecking emissions.
Local authorities need to do all they can to encourage residents to travel by cycling, e-bikes and walking, as well as public transport, in order to lower emissions and improve air quality.
Find out more
Learn from others
Change in your area is possible. Sometimes all it takes is a conversation between residents and councillors to get things off the ground. We’ve collated some examples to help get you thinking about how to improve energy in St. Helens. Could you and your local authority achieve something similar together?
Transport
20 Sep 2024
Learn how Waltham Forest engaged the local community to drive positive climate action that would last. Engaging the community is Action 3 in the 50-points Climate Action Plan for Councils, to use additional decision-making approaches for complex or contentious choices, such as representative citizen assemblies or citizens’ juries, participatory mapping and budgeting etc.
20 Sep 2024
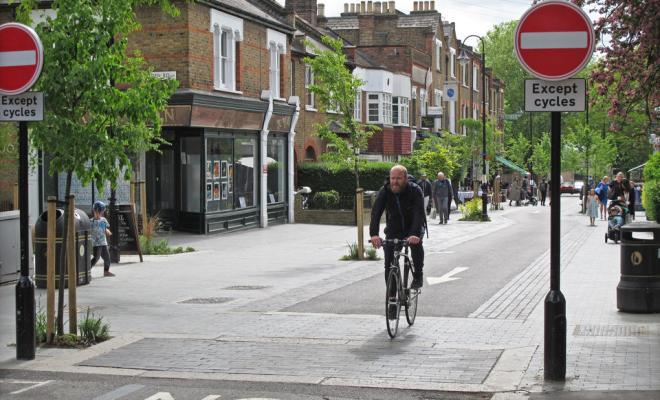
Learn how Leicester City Council’s active travel strategy is boosting bus use and cycling in the city. This investment forms part of the 50-point Climate Action Plan for Councils under Action 21, to prioritise transport investment in cycling, walking and public transport, with a priority of installing segregated cycleways on most roads, increasing space for pedestrians, and introducing a 20 mph speed limit in urban areas.
Energy
20 Sep 2024
Islington Council has created a joined-up network of services that aim to support vulnerable Londoners facing fuel poverty. This case study relates to Actions 11 and 14 of the 50-point Climate Action Plan for Councils. Action 11 includes identifying people most at risk of fuel poverty and targeting policies, actions and spending towards them, while Action 14 involves helping owner-occupied and fuel-poor homes be more energy efficient, for example via insulation.
20 Sep 2024
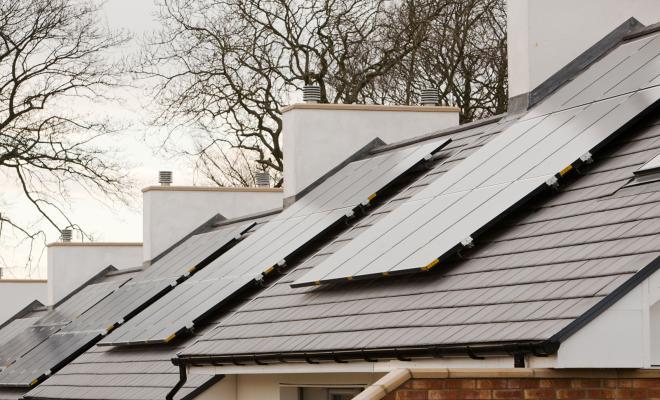
Learn how Stroud District Council is encouraging renewables in its Local Plan. Growing renewable energy generation by identifying suitable areas in the Local Plan is part of Action 29 in the 50-point Climate Action Plan for Councils.
Learn from others
Change in your area is possible. Sometimes all it takes is a conversation between residents and councillors to get things off the ground. We’ve collated some examples to help get you thinking about how to improve transport in St. Helens. Could you and your local authority achieve something similar together?
Buildings
20 Sep 2024
City of York Council is building 400 zero-carbon homes, using the innovative Passivhaus approach as part of its Climate Action Plan. Zero-carbon homes form part of Action 18 in the 50-point Climate Action Plan for Councils, to require buildings on council land to be extremely energy efficient, using the Passivhaus standard or similar.
20 Sep 2024
Lancaster City Council conducted a prompt review of its Local Plan to ensure the policies it contains will help tackle the climate crisis. Aligning plans, policies and guidance with climate targets forms part of Action 5 in the 50-point Climate Action Plan for Councils.
20 Sep 2024
Learn how South Gloucestershire Council raised £1.5 million from a housebuilding levy to fund climate infrastructure improvements. Using a housebuilding levy is Action 9 in the 50-point Climate Action Plan for Councils: use legal and planning mechanisms such as Section 106 agreements, the Community Infrastructure Levy, and other mechanisms to fund climate actions and nature restoration projects.
Transport
20 Sep 2024
Learn how Waltham Forest engaged the local community to drive positive climate action that would last. Engaging the community is Action 3 in the 50-points Climate Action Plan for Councils, to use additional decision-making approaches for complex or contentious choices, such as representative citizen assemblies or citizens’ juries, participatory mapping and budgeting etc.
Learn from others
Change in your area is possible. Sometimes all it takes is a conversation between residents and councillors to get things off the ground. We’ve collated some examples to help get you thinking about how to improve housing in St. Helens. Could you and your local authority achieve something similar together?
Transport
20 Sep 2024
Learn how Leicester City Council’s active travel strategy is boosting bus use and cycling in the city. This investment forms part of the 50-point Climate Action Plan for Councils under Action 21, to prioritise transport investment in cycling, walking and public transport, with a priority of installing segregated cycleways on most roads, increasing space for pedestrians, and introducing a 20 mph speed limit in urban areas.
20 Sep 2024
Learn how Leeds City Council is making all its vehicles electric and helping residents and businesses do the same. Transitioning to electric vehicles is one of 50 climate actions for councils, under Action 25, to deliver a rapid transition of the council’s own fleet to electric vehicles.
Buildings
20 Sep 2024
Learn how South Gloucestershire Council raised £1.5 million from a housebuilding levy to fund climate infrastructure improvements. Using a housebuilding levy is Action 9 in the 50-point Climate Action Plan for Councils: use legal and planning mechanisms such as Section 106 agreements, the Community Infrastructure Levy, and other mechanisms to fund climate actions and nature restoration projects.
20 Sep 2024
Learn how Liverpool City Council is creating warmer homes, by engaging with landlords and introducing a new 5-year selective licensing designation. This case study relates to Actions 10 and 15 of the 50-point Climate Action Plan for Councils. Action 10 involves implementing private-rented sector licensing to cover the enforcement costs of energy-efficiency compliance, while Action 15 is about rapidly enforcing minimum energy-efficiency standards and encouraging higher EPC levels in the private-rented sector.
Energy for St. Helens
« Change locationEnergy from wind and solar is now cheaper than coal and gas to produce. We need to produce 7x more renewable energy than our current output if we’re to secure warm, affordable homes for everyone and power industry and transport with green energy.
We’ve analysed data from a range of reputable sources to set individual targets for each local authority. Explore the page to see how St. Helens is performing against its targets. Could your local leaders do more to move away from fossil fuels?
Click or tap one of the leaves to see more detail
St. Helens's performance on energy is calculated using data related to renewable energy generation, fossil fuel investment and heat pumps in the area.
Key energy stats for St. Helens
27.4 GWh of renewable energy is currently generated in your area each year. St. Helens needs to generate 168.4 GWh of energy per year to reach the target recommended by government advisors, the Climate Change Committee.
Friends of the Earth believes St. Helens should be more ambitious and strive to reduce its reliance on fossil fuels by generating 336.8 GWh per year.
Local authorities can increase renewable energy output and lower emissions by identifying areas suitable for generation, switching street lights to LED and reducing energy use in council-owned buildings.

| Label | Value |
| CCC target for St. Helens | 168.4 GWh |
| Friends of the Earth's target in St. Helens | 336.8 GWh |
| Current output in St. Helens | 27.4 GWh |
The expert's opinion

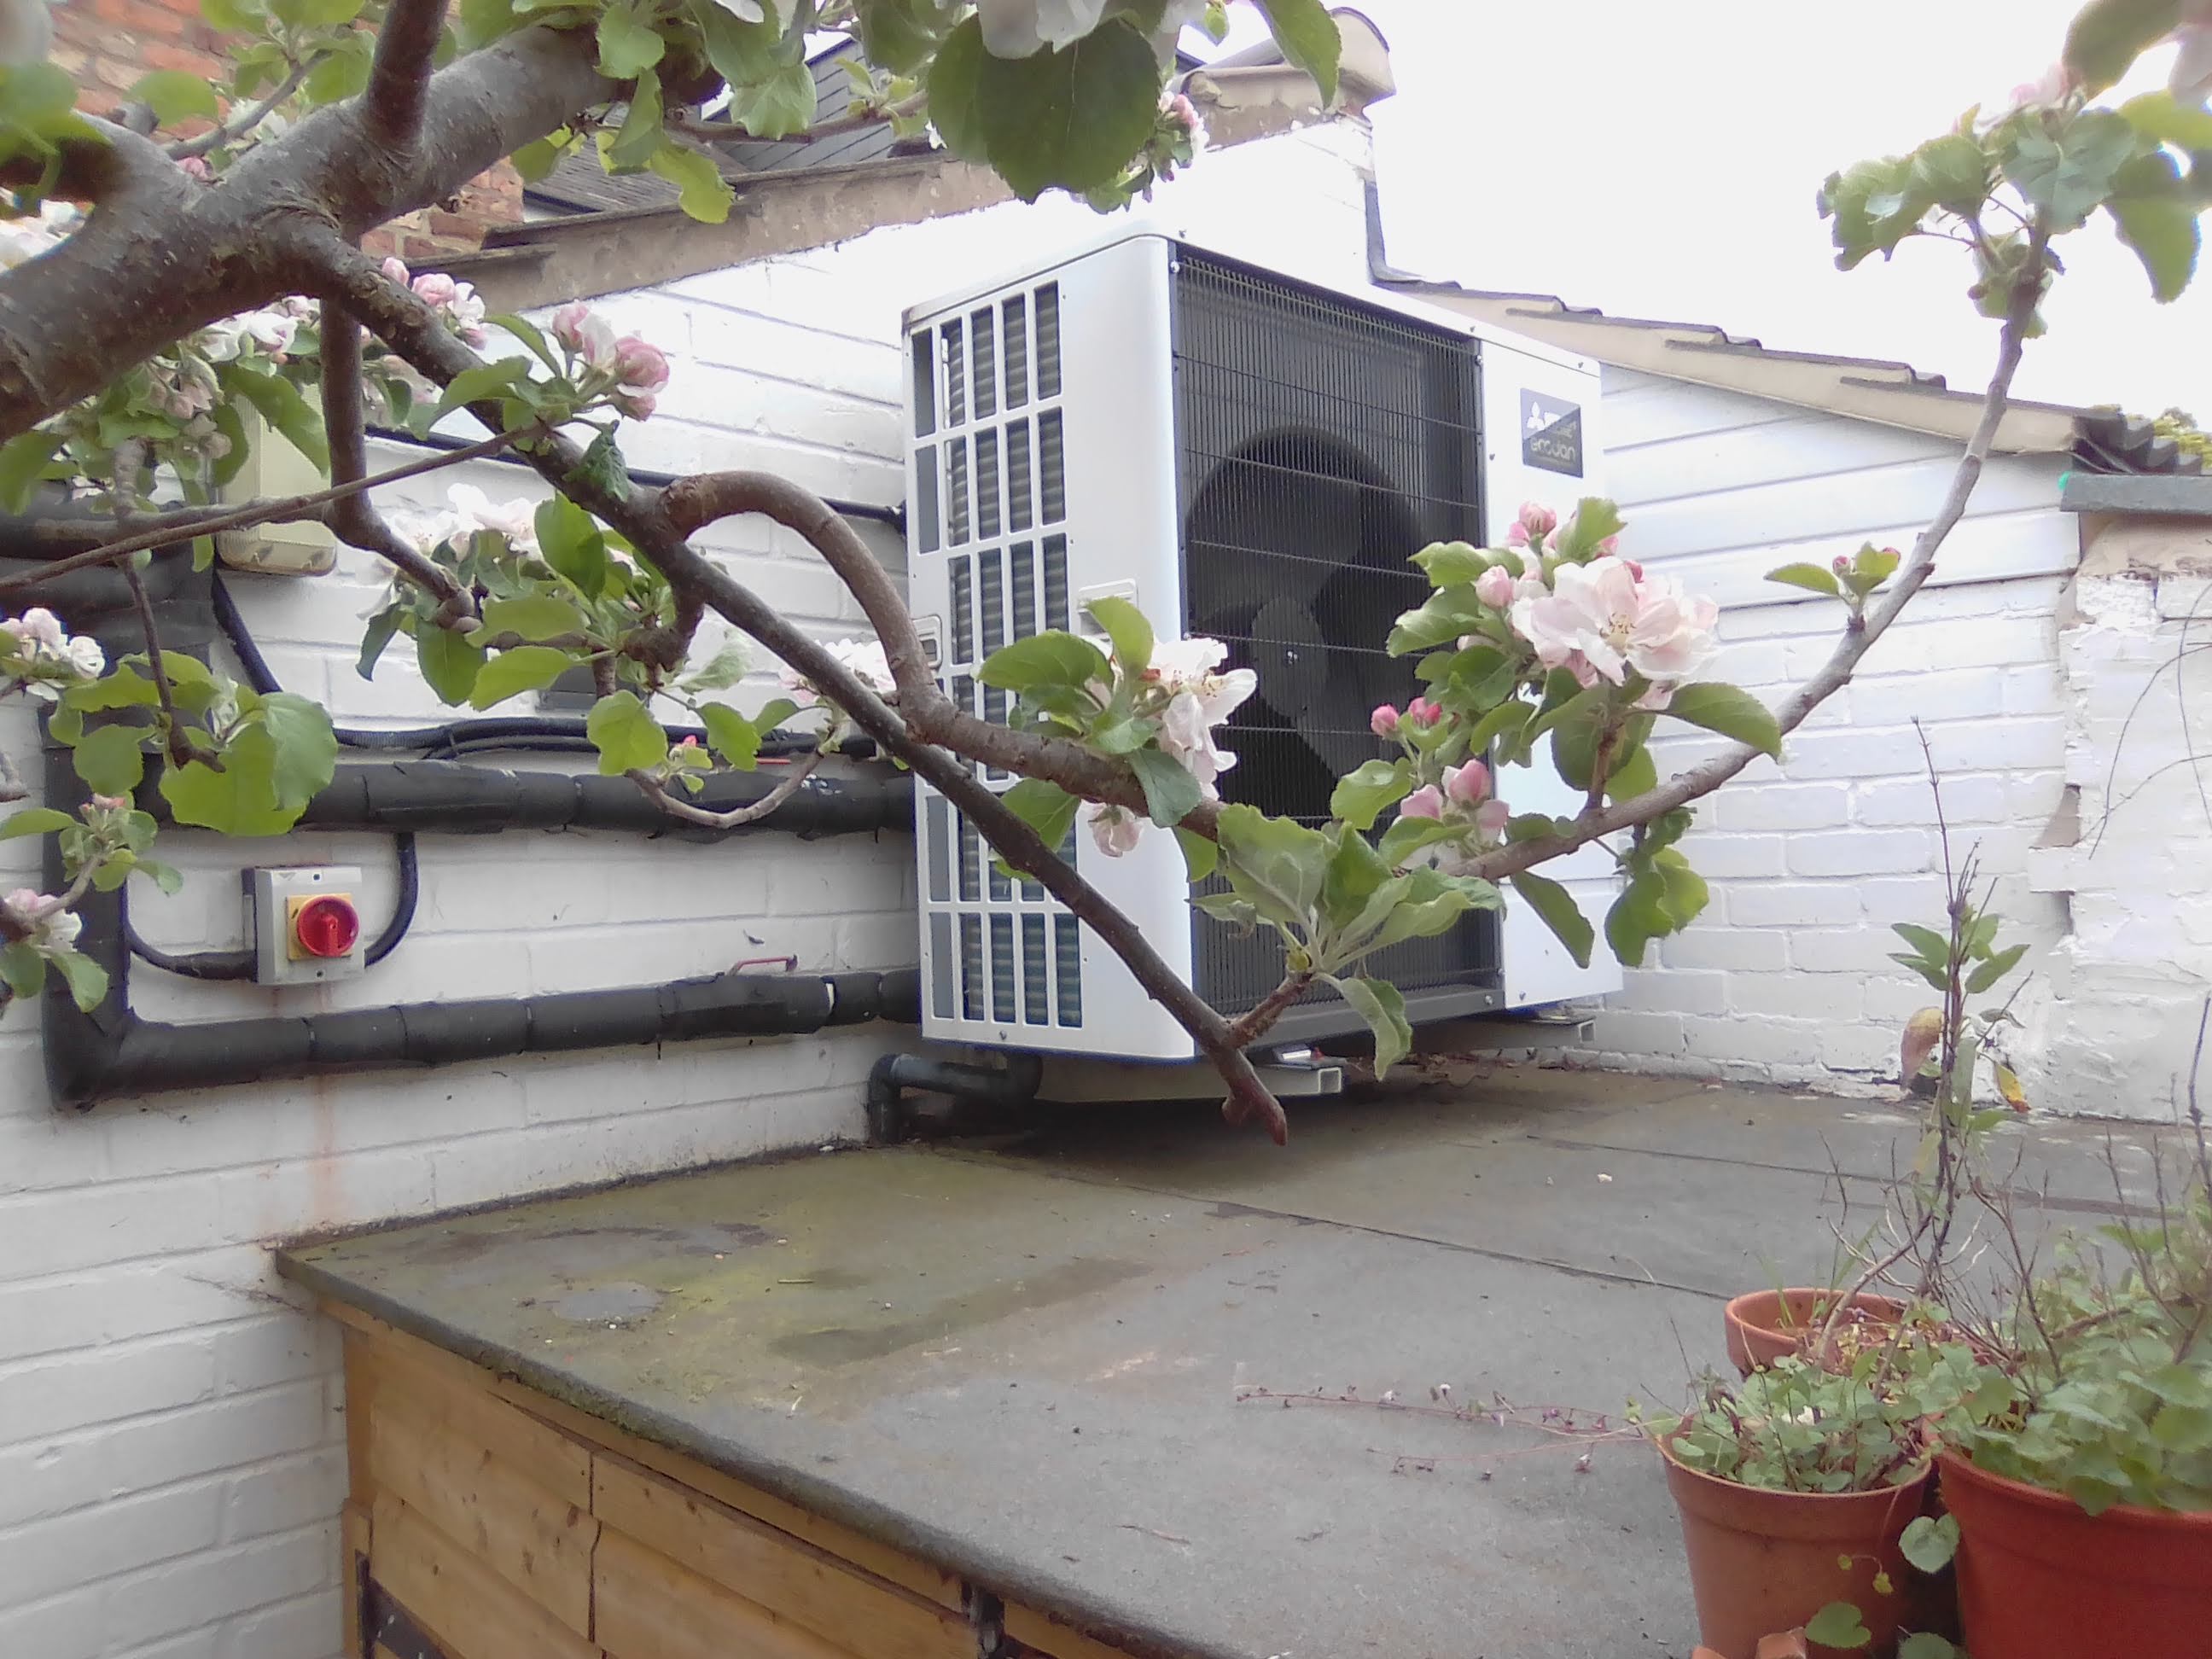
Heat pumps are green alternatives to the climate-wrecking oil and gas traditionally used to heat our homes.
There are currently 104 heat pumps in St. Helens. To meet the 2030 target of the Climate Change Committee (the government's advisors), 1,942 heat pumps should be installed per year in St. Helens.
Friends of the Earth believes St. Helens could do better, and install 3,541 heat pumps per year to help keep homes warm and lower emissions.
| Label | Value |
| CCC target for heat pumps in St. Helens by 2030 | 15,637 |
| Current number of heat pumps in St. Helens | 104 |
According to polling, most of us want our pension pot to be invested in safe, ethical companies. But for years, UK councils have invested billions of pounds of our pension money in companies drilling for new coal, gas and oil.
St. Helens invests in fossil fuels through its contributions to Merseyside Pension Fund, which still has £240,466,000 invested in these climate-wrecking fuels. The diagram shows the breakdown of that investment between oil and gas projects vs coal projects.
St. Helens should divest completely from fossil fuels as soon as possible.

| Label | Value |
| Oil and gas | £157 m |
| Coal | £83 m |
Do people in St. Helens want a wind turbine in the area?
59% of 296 people surveyed in St. Helens say they wouldn’t mind a wind turbine in their area, according to 2021 polling by YouGov.
Onshore wind produces the cheapest electricity, so wind farms will lead to reduced energy bills, greatest energy security, and cut carbon emissions.

| Label | Value |
| Yes | 59% |
| No | 18% |
| Don't know | 23% |
Homes in St. Helens
« Change locationOur homes should be a source of comfort. Yet things like soaring bills and poor public services can impact our efforts to keep a home warm and clean.
Uncover the data to see whether St. Helens is doing all it can to ensure you and your neighbours have decent places to live.
Click or tap one of the leaves to see more detail
St. Helens's performance on homes is based on data related to home insulation, eco-heating systems and recycling rates.
Key stats for homes in St. Helens
The energy crisis affects us all differently. Neighbourhoods with below-average incomes and higher-than-average energy bills must be prioritised for urgent support by local authorities.
There are 119 neighbourhoods in St. Helens. Of these, we’ve identified 32 neighbourhoods that most need support to help keep homes warm and bills down.
The type of support suggested in the map is determined by factors such as proportion of rental vs owned homes, and current household energy efficiency performance.
| Label | Value |
The energy crisis
Explore the map to see which neighbourhoods need the most urgent support to deal with the energy crisis.
Zoom or drag to explore the full map. Click to see more detailed information for an area.
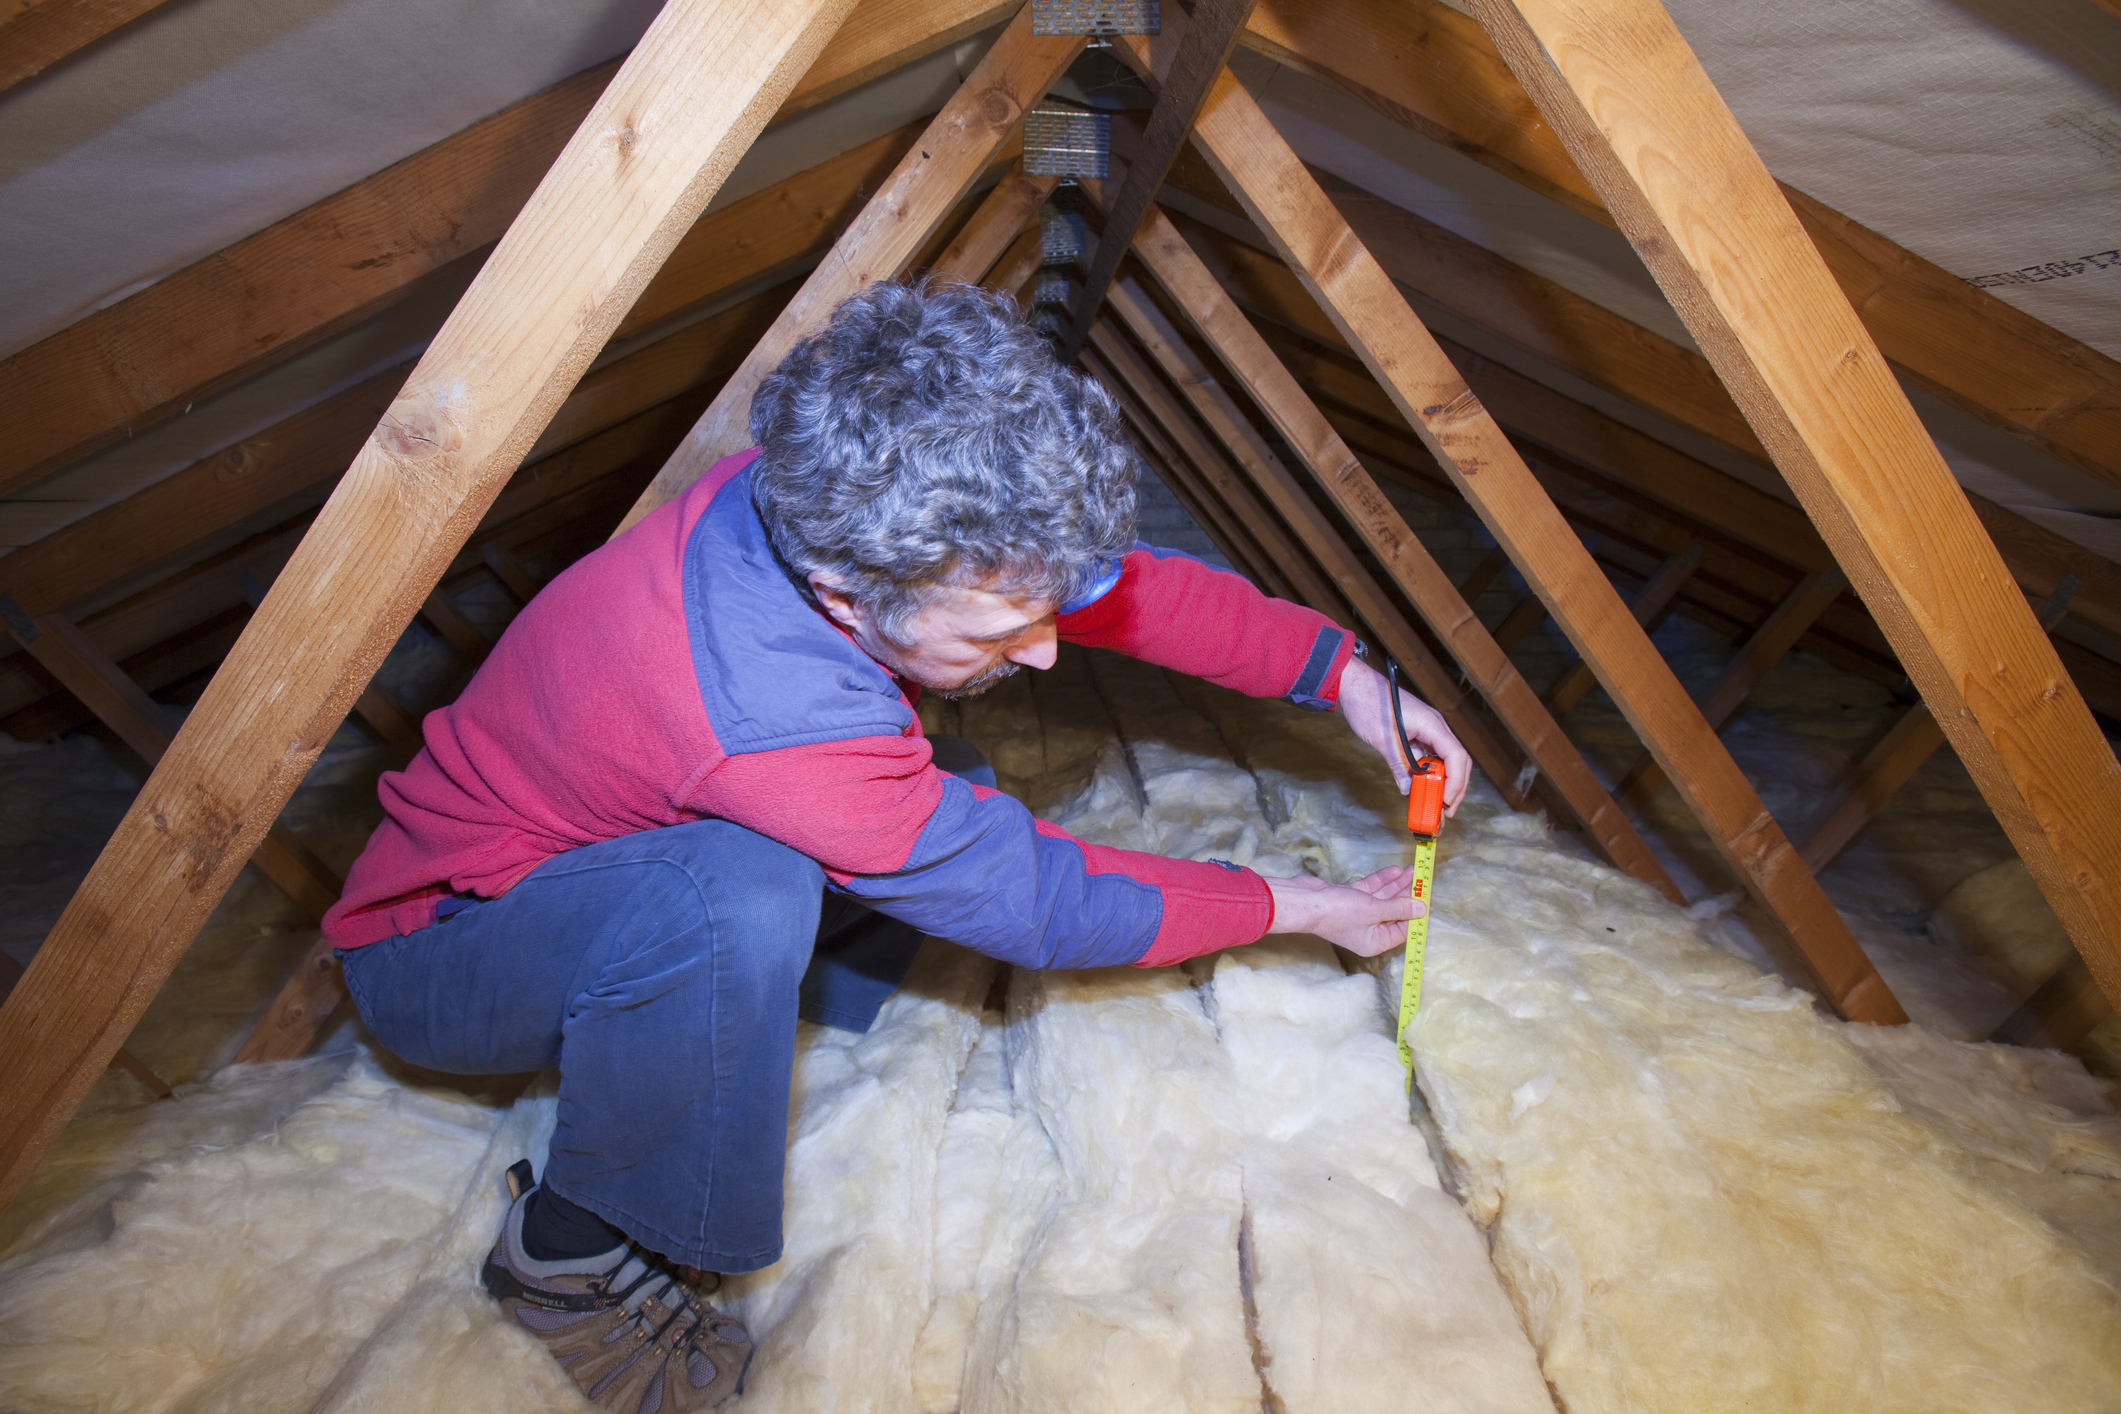
Properly insulated homes can help prevent energy wastage and combat fuel poverty by reducing eye-watering bills.
59% of homes in St. Helens are rated EPC D to G, meaning they're not energy efficient. Of these, 20,900 homes would benefit from free loft insulation and 15,700 from free cavity wall insulation.
The government recommends that all homes be EPC C or above by 2035. To achieve that target, 3,833 homes need to be insulated per year. But that means people already struggling with energy bills could face many more years of cold and hardship.
Friends of the Earth thinks St. Helens should aim to help as many people as quickly as possible by upgrading insulation in at least 6,228 homes per year.
| Label | Value |
| Energy efficient homes target St. Helens | 100% |
| Well-insulated homes in Knowsley (best similar area) | 57% |
| Well-insulated homes in St. Helens | 41% |
The human impact of the energy crisis

Heat pumps are green alternatives to the climate-wrecking oil and gas traditionally used to heat our homes.
There are currently 104 heat pumps in St. Helens. To meet the 2030 target of the Climate Change Committee (the government's advisors), 1,942 heat pumps should be installed per year in St. Helens.
Friends of the Earth believes St. Helens could do better, and install 3,541 heat pumps per year to help keep homes warm and lower emissions.

| Label | Value |
| CCC target for heat pumps in St. Helens by 2030 | 15,637 |
| Current number of heat pumps in St. Helens | 104 |
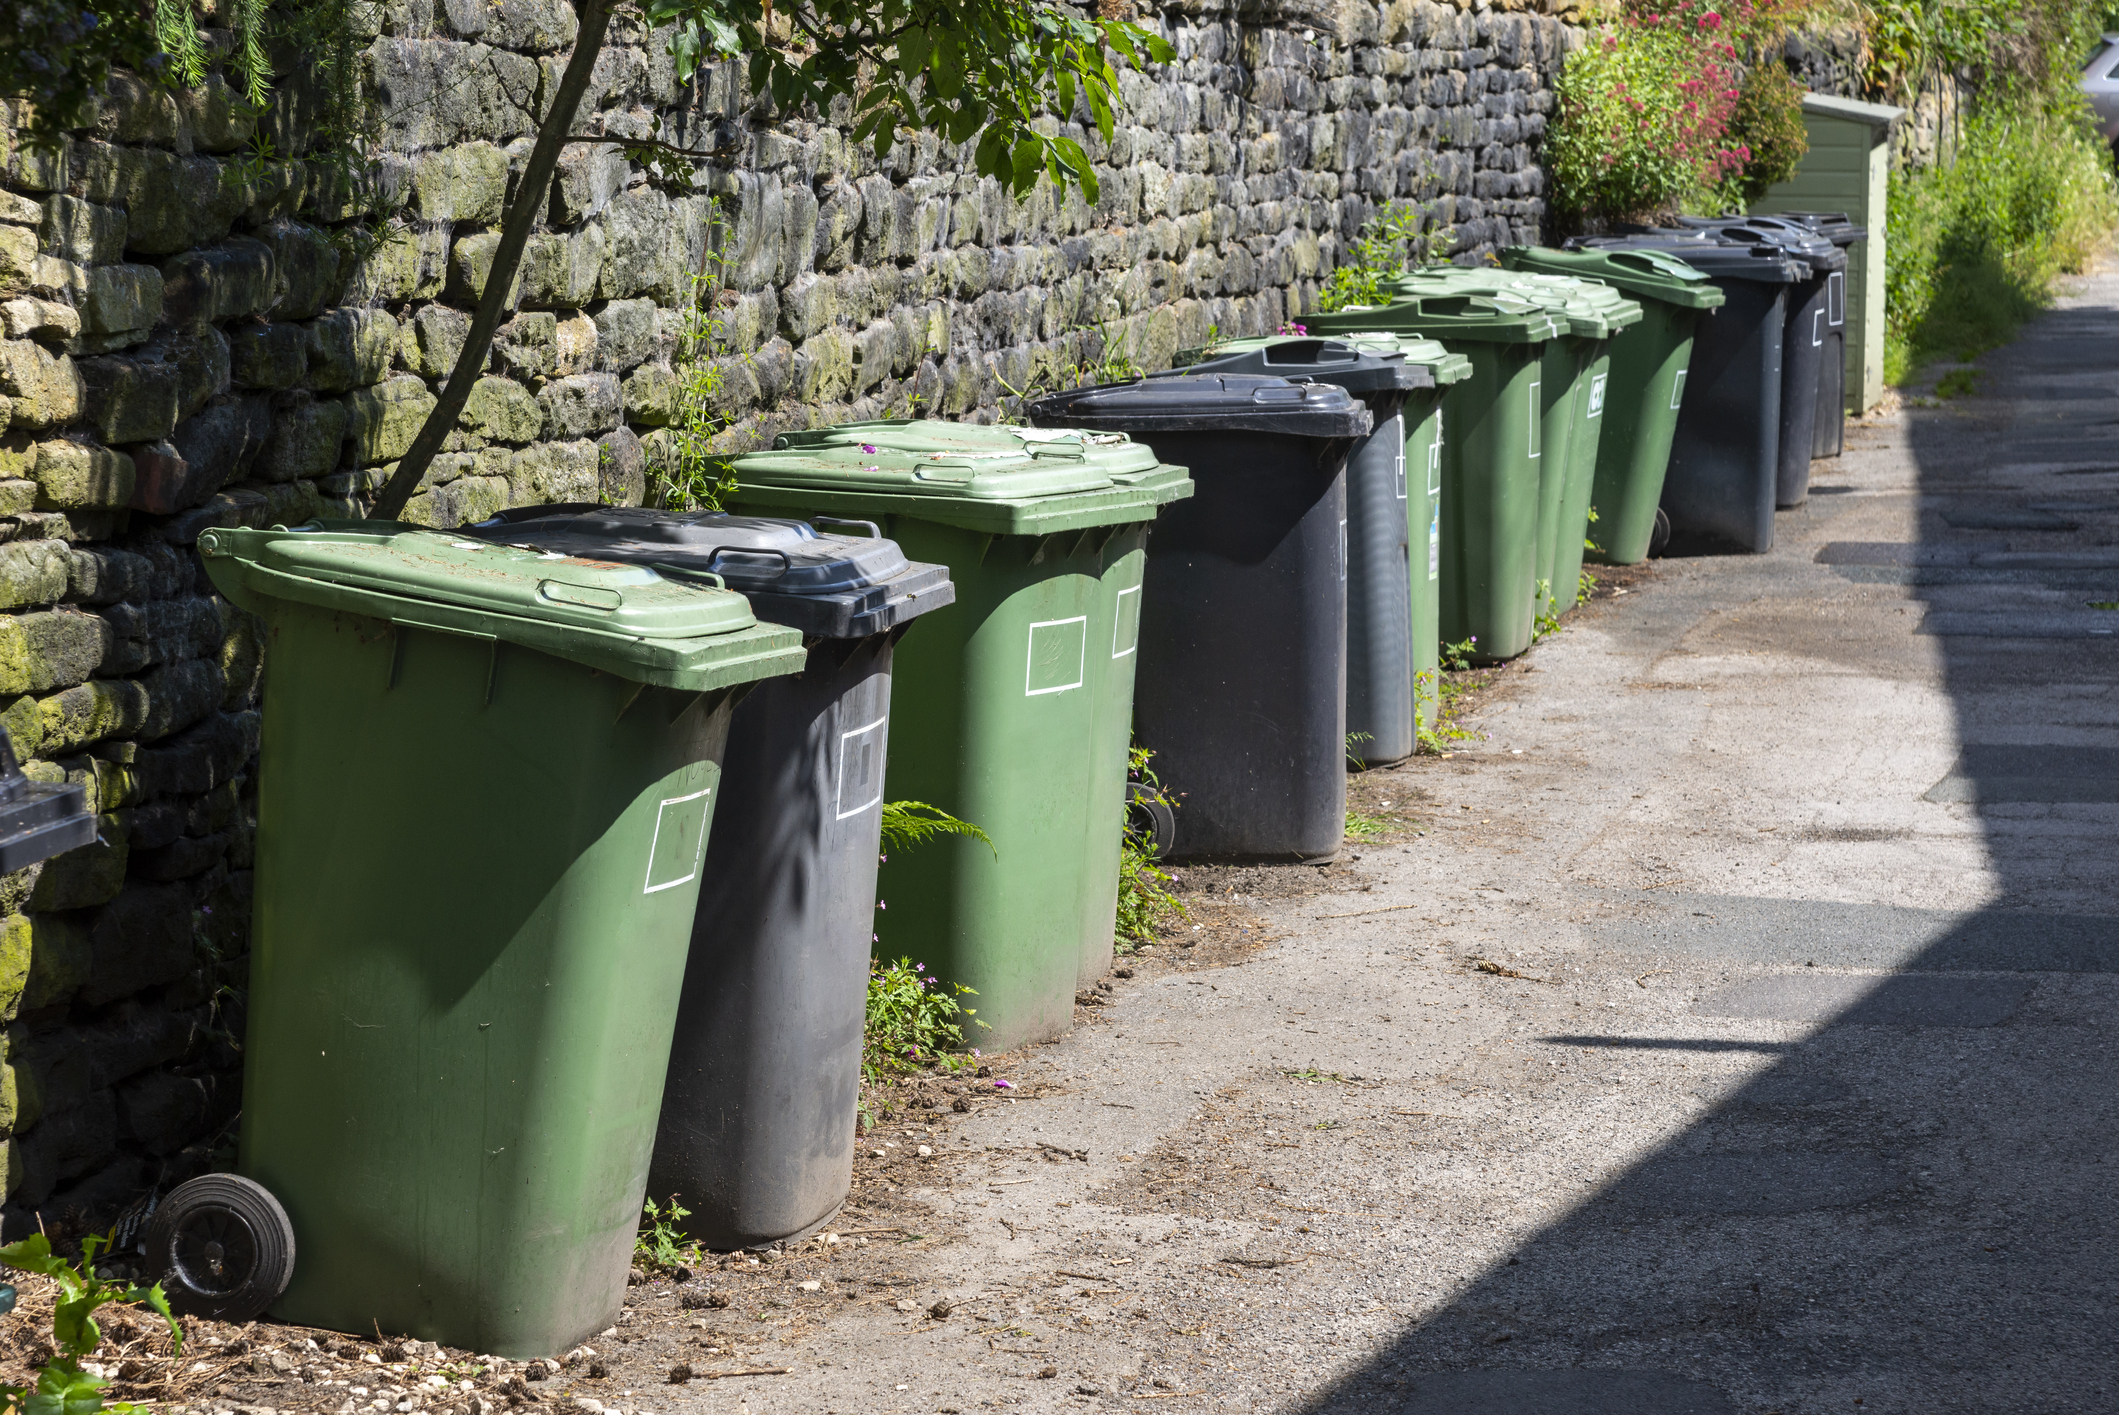
Currently, 35% of waste in St. Helens is reused, recycled or composted.
With its score of 63%, Bridgend is the best performing area of its type.
Friends of the Earth believes St. Helens should be more ambitious and aim to reuse, recycle or compost 100% of its household waste by 2030.
| Label | Value |
| Friends of the Earth's recycling target | 100% |
| Recycling rates in Bridgend (the best performing similar local authority) | 63% |
| St. Helens's current recycling rate | 35% |
90% of 296 people surveyed in St. Helens say they make an effort to recycle according to 2021 YouGov national opinion polling.

| Label | Value |
| Yes | 90% |
| No | 3% |
| Don't know | 6% |
Transport in St. Helens
« Change locationTransport is the biggest source of carbon emissions in the UK. Local authorities like St. Helens have an important role to play in reducing those emissions, tackling air pollution and changing our transport systems for the better.
Explore the page to see how St. Helens is performing against different transport targets and, where possible, how it compares to other areas.
Click or tap one of the leaves to see more detail
St. Helens's performance on transport is based on data related to cycling rates and commutes made by low-carbon options.
Key transport stats for St. Helens
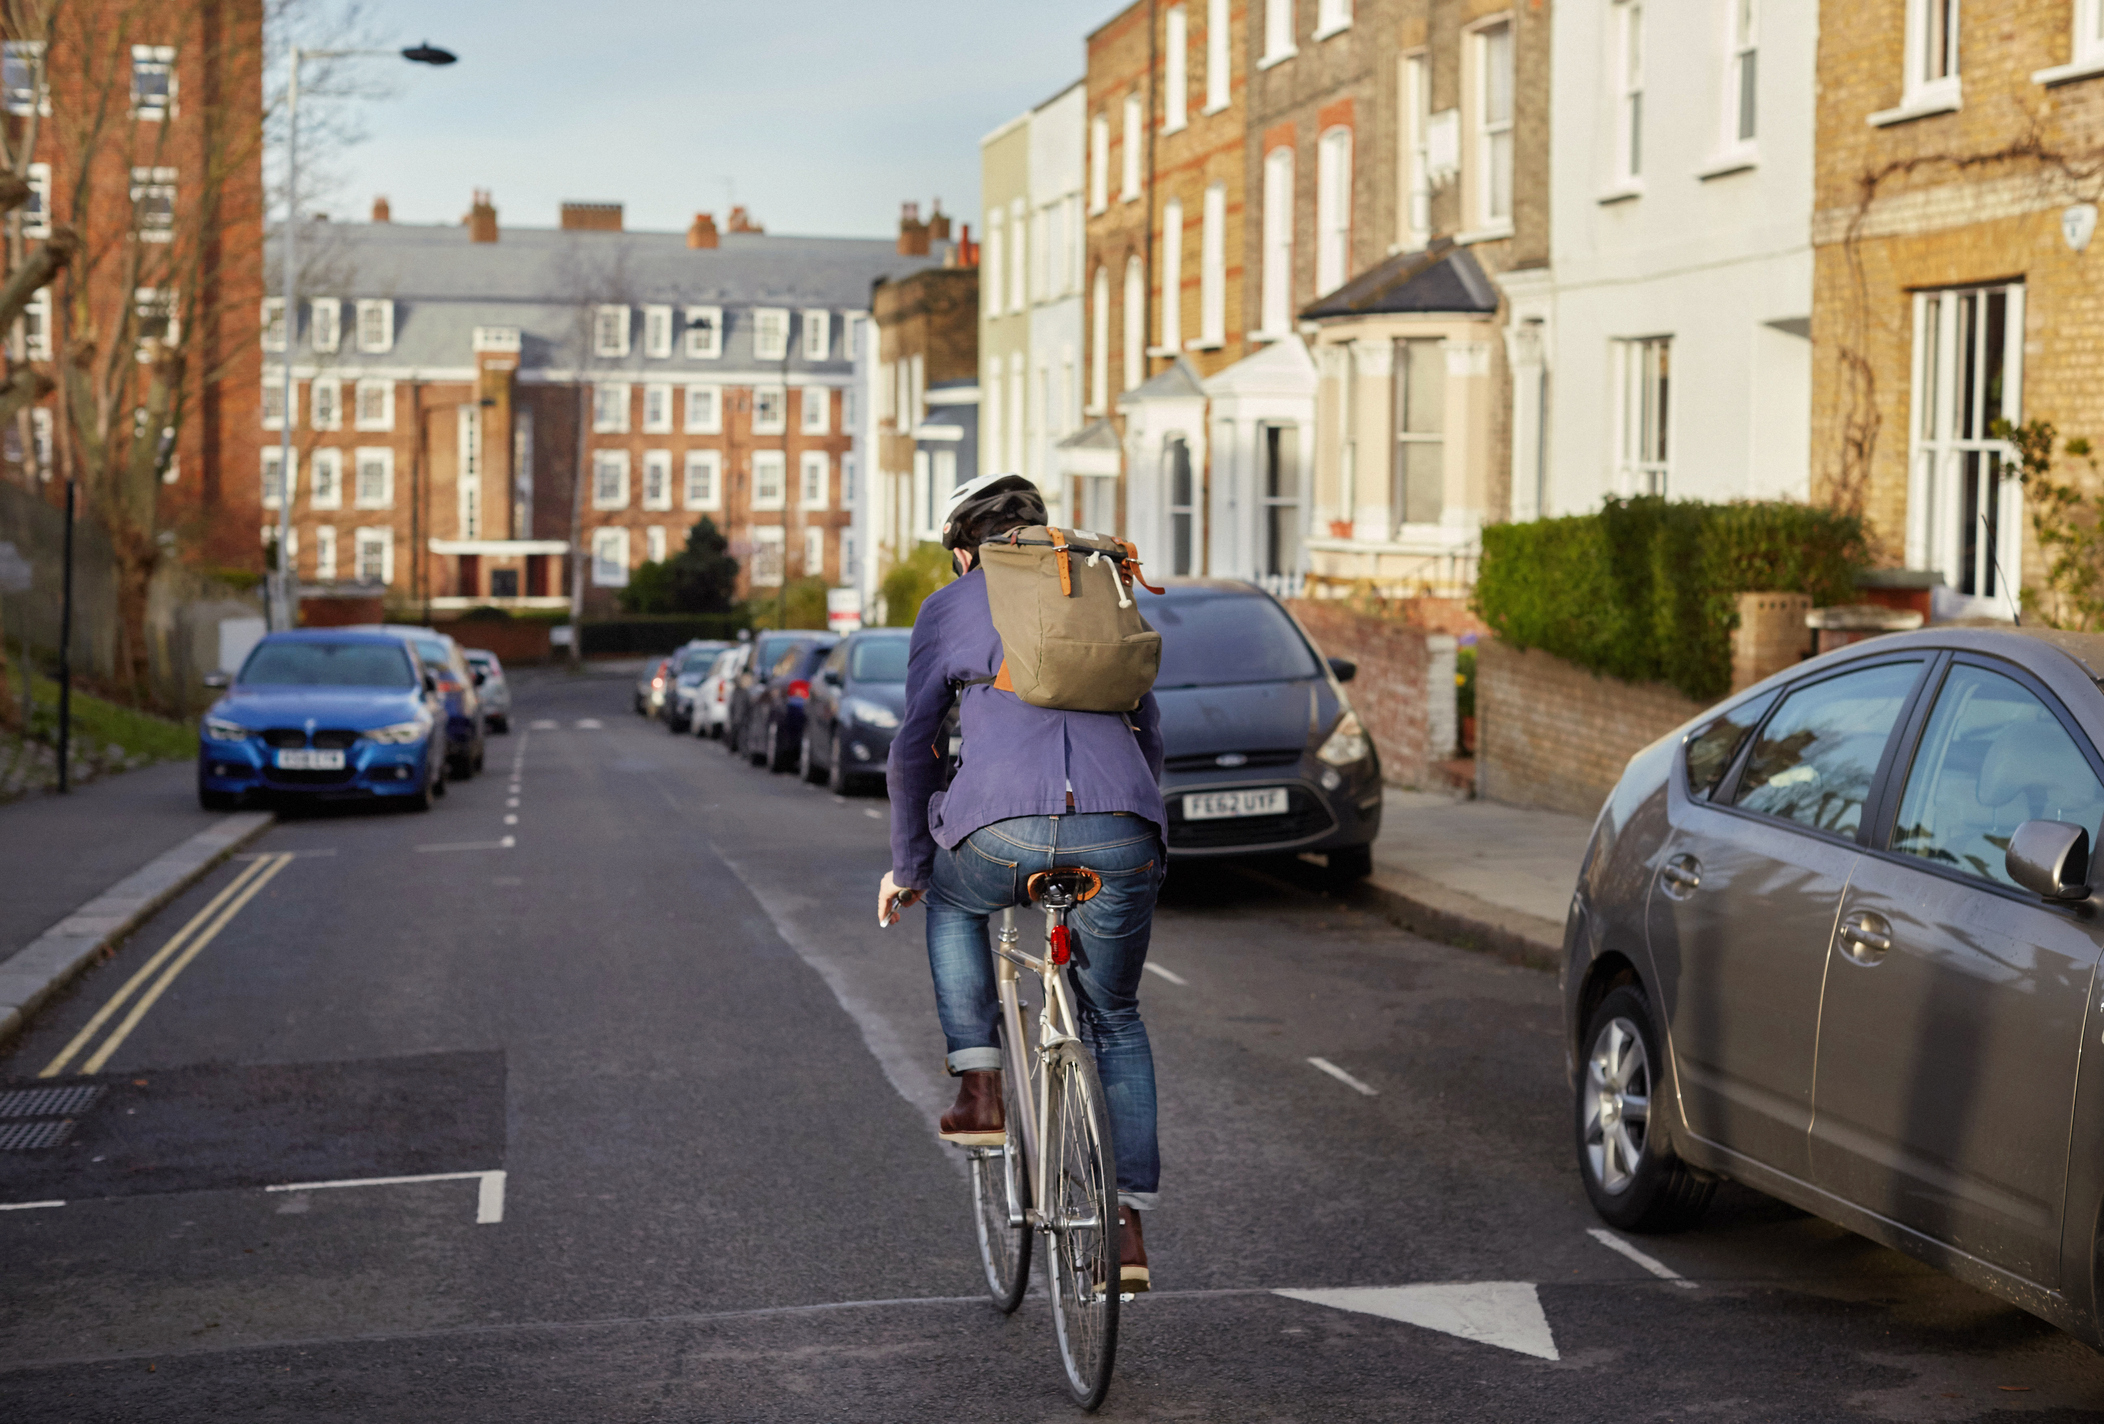
Cycling produces next to no emissions and is therefore one of the most climate-friendly ways to travel. It also benefits our health and wellbeing.
Currently, 1% of people in St. Helens commute to work by cycling. For reference, the highest score for this local authority category is 12%.
27% of commuter journeys in St. Helens could be by bike, as long as there’s decent cycling infrastructure and an uptake in the use of e-bikes.
| Label | Value |
| Target for commutes by bike | 27% |
| Percentage of commutes by bike | 1% |
A green commute means traveling to work via low-carbon options, such as public transport, cycling, or walking.
20% of people in St. Helens currently choose greener ways to commute.
Of those, 9% walk to work, 1% travel by bike and 10% use public transport.
South Tyneside is the best performing local authority of its category (33% opt for a green commute).
The Climate Change Committee (which advises government) has set St. Helens and other similar local authorities a target of 35% of travel to be made by greener methods. Friends of the Earth thinks St. Helens could do a little better, and aim for 50% of all travel.

| Label | Value |
| Government target | 35% |
| Commutes by low carbon forms of travel | 20% |
The expert's opinion

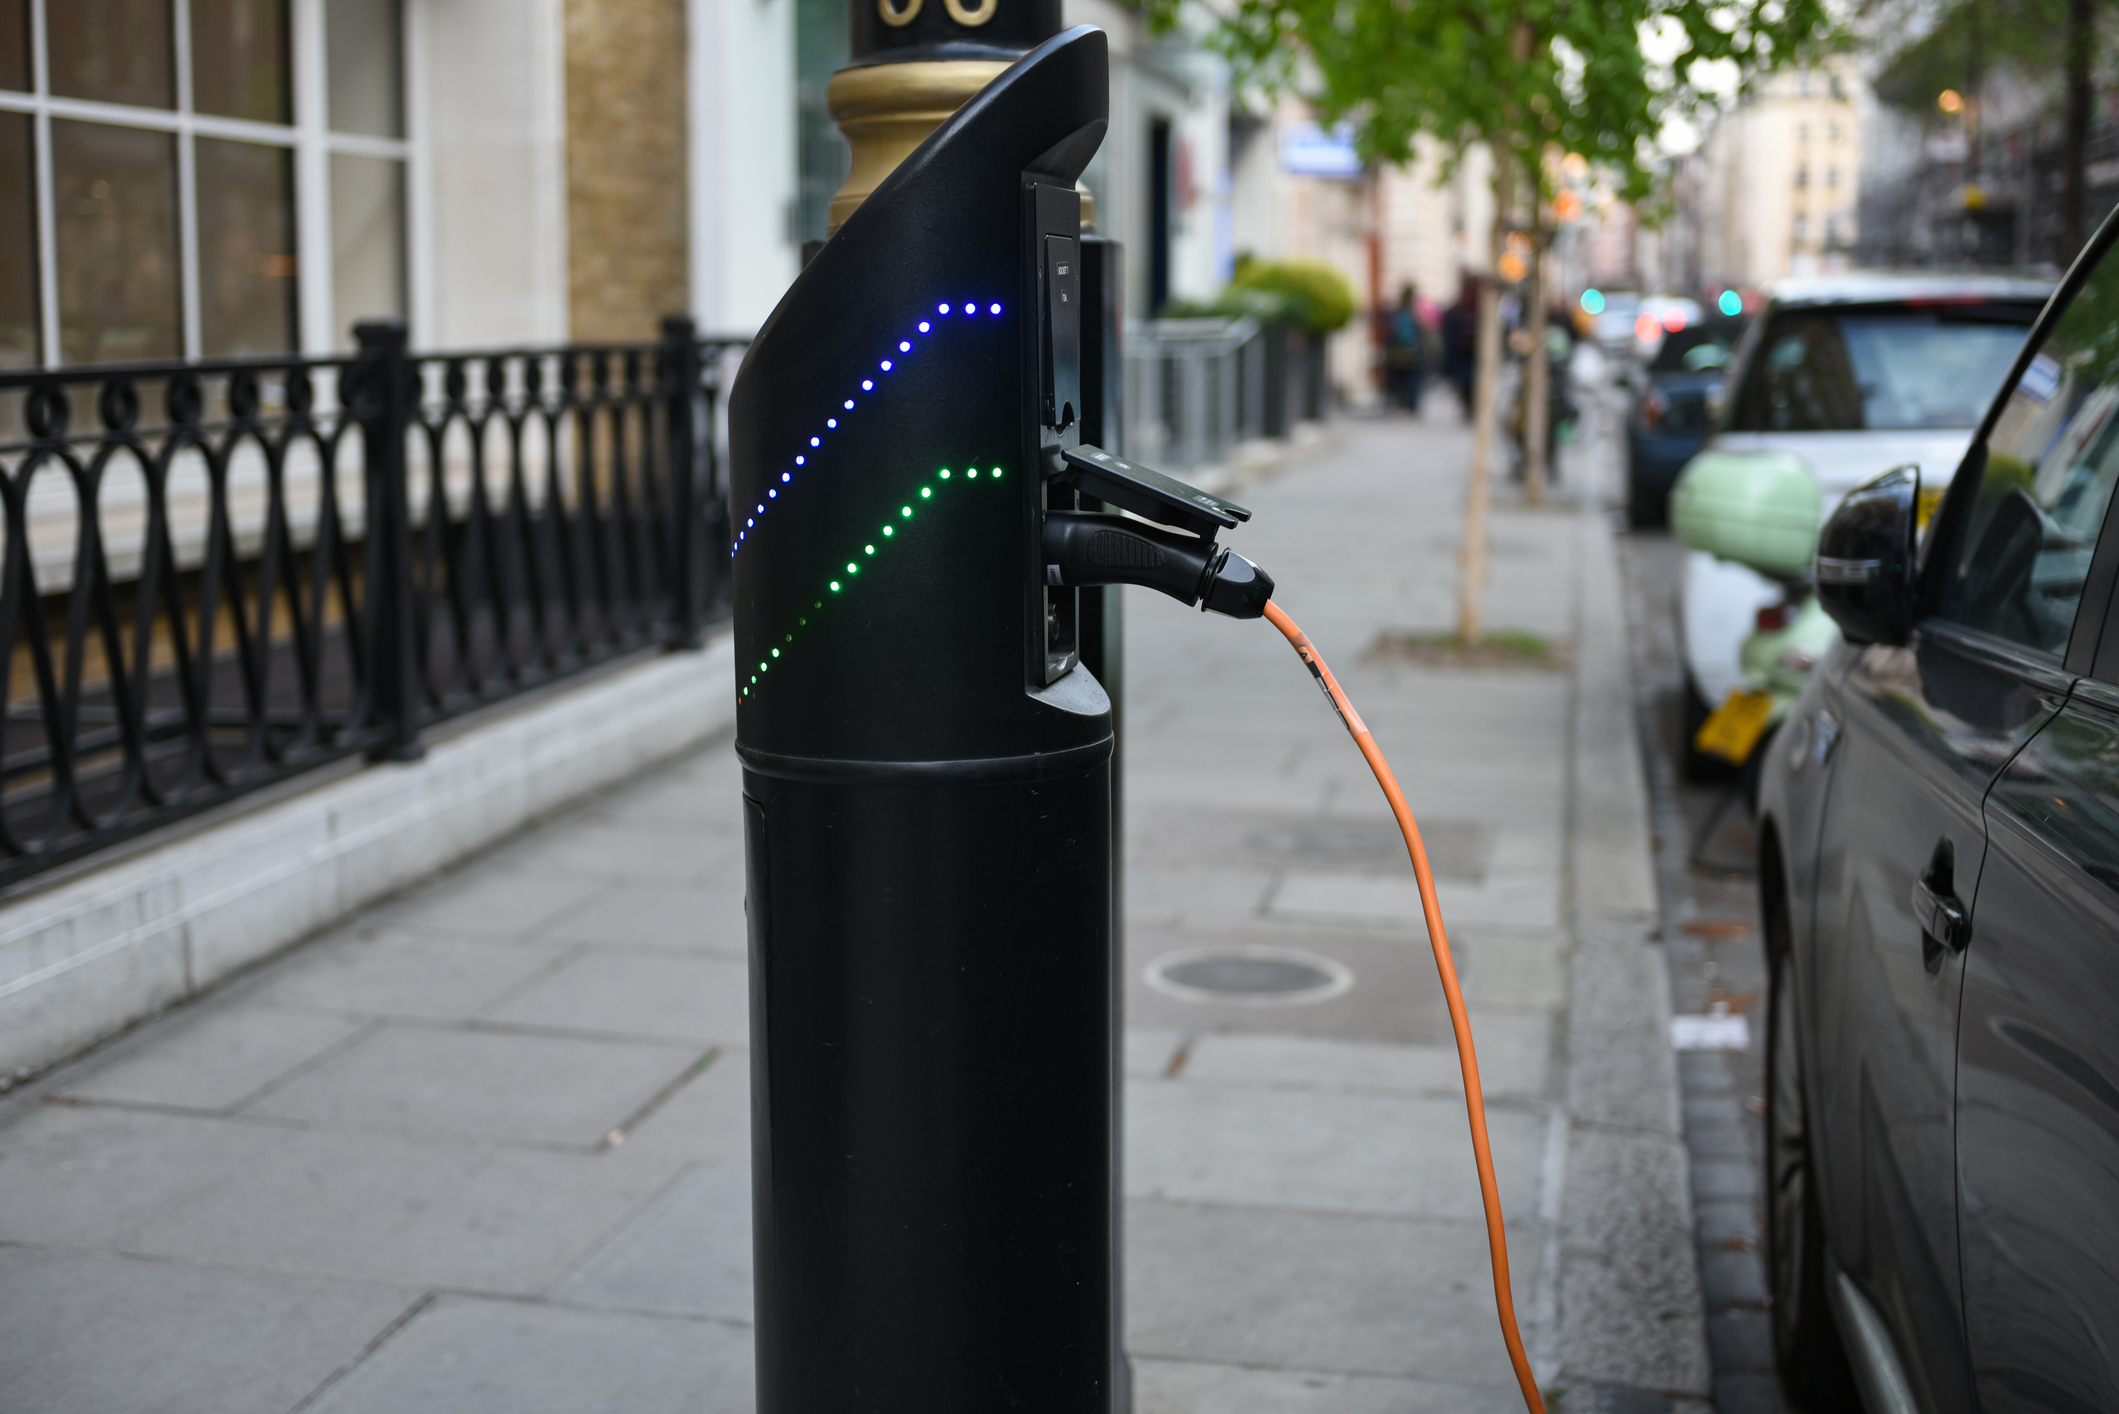
Electric cars and vans help lower fuel costs and noise pollution, and avoid pumping out harmful pollutants. Local authorities can help make electric vehicles (EV) a more attractive choice for their residents by installing public charging points.
There are currently 25 public EV charging points in St. Helens.
According to government targets, St. Helens should aim to install 791 EV charging points by 2030.
| Label | Value |
| Government target for EV charging points in St. Helens | 791 |
| Current number of EV charging points | 25 |
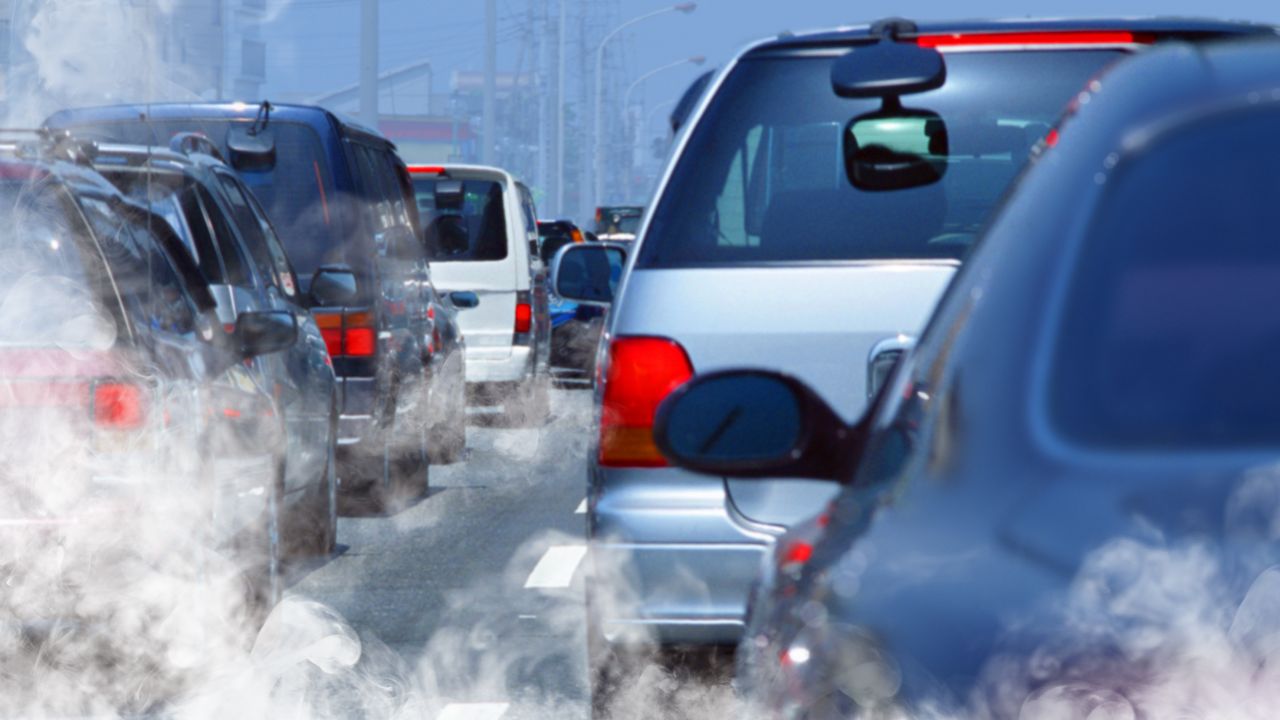
We suffer unnecessarily high levels of air pollution in the UK.
While there are multiple sources contributing to our poor air quality, road traffic is particularly notorious because it’s largely responsible for unsafe levels of nitrogen oxide. As with most climate issues, it’s the people that contribute the least to the problem that are most impacted: households in neighbourhoods with the worst air pollution are up to 3 times less likely to own a car than those in the least polluted areas.
Councils are required to address areas with illegal levels of air pollution, and a couple of ways they can do this is by reducing road traffic and making public transport and active travel accessible for everyone.
| Label | Value |
Air pollution in St. Helens
Zoom into the map to see the schools, play spaces and parks within your area, and whether they’re affected by air pollution.
Zoom or drag to explore the full map. Click to see more detailed information for an area.
Nature in St. Helens
« Change locationThe health of our natural world impacts us all. Without biodiversity and good quality green spaces, we lose valuable carbon stores and essentials such as food and fresh water. What’s more, it’s proven that time in nature is good for our wellbeing.
But our natural world is suffering. Local leaders in areas like St. Helens can help nature recover by improving land use and committing resources to nature restoration.
Click or tap one of the leaves to see more detail
St. Helens's performance on nature is based on data related to woodland cover in the area, and access to green space.
Nature in St. Helens
« Change locationThe health of our natural world impacts us all. Without biodiversity and good quality green spaces, we lose valuable carbon stores and essentials such as food and fresh water. What’s more, it’s proven that time in nature is good for our wellbeing.
But our natural world is suffering. Councils in Wales can help nature recover by improving land use and committing resources to nature restoration.
Data specific to Welsh councils on things like woodland opportunity and access to green space is not yet available on this tool, but whether you’re a campaigner or a councillor, you can still explore our library of nature-based initiatives below to help inspire action.
Click or tap one of the leaves to see more detail
St. Helens's performance on nature is based on data related to woodland cover in the area, and access to green space.
Good quality green spaces are essential to cooling our towns and reducing flood risk. And they’re also proven to be great for our health, helping reduce heart disease, obesity, and depression. In fact, green spaces save the NHS more than £100 million each year in GP visits and prescriptions.
Despite all their benefits, green spaces are out of reach for certain communities.
In your area, 92% of people have good access to gardens, parks and open access land, whereas 8% live in neighbourhoods deprived of green space.
Is St. Helens doing all it can to make sure all its residents can access their dose of the outdoors?

| Label | Value |
| Access to green space | 92% |
| Deprived of green space | 8% |
Do you live close to green space?
Explore the map to find out which areas in your local authority are in need of more green space.
Zoom or drag to explore the full map. Click to see more detailed information for an area.
The expert's opinion

Where do we need more trees?
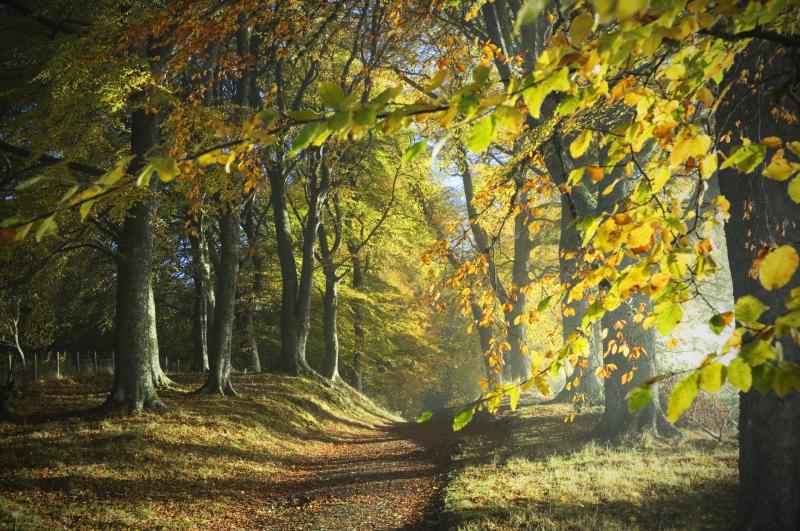
Following centuries of destruction of our ancient woodlands and forests, just 10% of England is now covered in woodland, compared to an EU average of 38%. Many of our urban areas also have very poor tree cover.
11.8% of St. Helens is covered in trees, of which 9.4% is woodland. The highest level of tree cover found is in Surrey Heath (the best performing similar local authority) with 36.1%.
According to research by mapping experts Terra Sulis, 21 hectares of land may be suitable for new woodlands in St. Helens. Of this, 33.3% could be delivered through rewilding schemes. Don’t worry if woodland opportunity in your area is low as, due to data limitations, the map doesn't identify the potential for new trees in urban areas such as street trees, public parks and gardens. More of these street trees are also needed, and the council should set a target of at least 10% for all neighbourhoods, with an aspiration of reaching 20%. See how Hackney has been increasing urban tree cover and green space.
Tree cover and woodland opportunities
Zoom or drag to explore the full map. Click to see more detailed information for an area.
A guide to our trees map
Our tree cover and woodland opportunity map shows how deprived of tree cover many areas in England are, especially lower income neighbourhoods. It also reveals it would be possible to almost double woodland cover in England without encroaching on high-value arable farmland, Priority Habitats, peat bogs or protected nature sites. Find out more about the key findings, methodology and top locations for tree planting.
Health in St. Helens
« Change locationOur health is hugely affected by the air we breathe, the food we eat, and our surrounding environment.
Things like pollution, poorly insulated homes and a lack of green space can tip the odds against our chance of a healthy life.
Are there ways your local authority could reduce the health risks for you and your neighbours?
Click or tap one of the leaves to see more detail
St. Helens's performance on health is based on data related to meat and dairy consumption, access to green space, and levels of fuel poverty in the area.
Key health stats for St. Helens
Good quality green spaces are essential to cooling our towns and reducing flood risk. And they’re also proven to be great for our health, helping reduce heart disease, obesity, and depression. In fact, green spaces save the NHS more than £100 million each year in GP visits and prescriptions.
Despite all their benefits, green spaces are out of reach for certain communities.
In your area, 92% of people have good access to gardens, parks and open access land, whereas 8% live in neighbourhoods deprived of green space.
Is St. Helens doing all it can to make sure all its residents can access their dose of the outdoors?

| Label | Value |
| Access to green space | 92% |
| Deprived of green space | 8% |
Access to nature
Zoom or drag to explore the full map. Click to see more detailed information for an area.
Air pollution is the UK’s largest environmental health risk, causing up to 36,000 early deaths each year.
Dirty air leads to worsening respiratory symptoms, heart disease and even lung cancer. Air pollution has even been associated with changes in the brain linked to dementia and can lead to children growing up with smaller lungs. All of which put place additional stress on our health services.
Councils are required take action in areas with illegal levels of air pollution. In order to improve air quality and reduce the risk to our health, they should urgently introduce measures to reduce road traffic and make public transport and active travel accessible for everyone.

| Label | Value |
Air pollution in St. Helens
Zoom into the map to see the schools, play spaces and parks within your area, and whether they’re affected by air pollution.
Zoom or drag to explore the full map. Click to see more detailed information for an area.
The average person in St. Helens currently consumes 320.7g of meat and dairy each day.
Too much meat and dairy can lead to illnesses like heart disease, diabetes and obesity. Friends of the Earth and numerous health groups believe St. Helens should aim to halve its meat and dairy intake, as part of a UK-wide target of 50% reduction.
Halving the amount of meat and dairy we consume won’t just benefit our health, it’ll also cut emissions from agriculture by 25-40%.

| Label | Value |
The expert's opinion

Fuel poverty affects people that struggle to heat their homes properly. Cold homes can mean a higher chance of respiratory illness and are particularly harmful to those with pre-existing health conditions.
According to government data, 14% of households in St. Helens currently live in fuel poverty.
However, that number is set to increase because of the rising cost of living and soaring energy bills. The energy crisis map shows the neighbourhoods most in need of support, and the type of support that could be most useful.
St. Helens should do all it can to help residents insulate their homes and keep warm.
Energy crisis
Explore the map to see which neighbourhoods need the most urgent support to deal with the energy crisis.
Zoom or drag to explore the full map. Click to see more detailed information for an area.
Community in St. Helens
« Change locationA greener, healthier world should be possible for St. Helens's entire community – not just those that can afford to make eco-friendly choices.
That’s why ensuring every resident gets a fair say and engaging local leaders are both vital to making a difference in your area.
From generating new green jobs to building relationships with local people, find out what can be done to make your community better for everyone.

St. Helens could create more jobs
Green jobs are jobs that include a focus on reducing carbon emissions or restoring nature. They can provide long-term livelihoods for employees and help address unemployment in the area.
1,513 new green jobs could be created in St. Helens by 2030, according to the Local Government Association.
Friends of the Earth is also calling for 780 green apprenticeships in St. Helens by 2023, so we can ensure a better, more stable planet for future generations to inherit.

| Label | Value |
| Alternative fuels | 85 |
| Energy efficiency | 495 |
| Low carbon electricity | 151 |
| Low carbon heating | 541 |
| Low emissions vehicles | 162 |
| Low carbon services | 77 |
The expert's opinion

Climate groups near St. Helens
Friends of the Earth has 250+ Climate Action groups across England, Wales and Northern Ireland. Here are the groups in your area.
According to polling, 59% of 296 people sampled in St. Helens think that climate change is the biggest threat to civilisation.
Polling was conducted by YouGov in 2021.

| Label | Value |
| Yes | 59% |
| No | 18% |
| Don't know | 23% |
Connect with your local leaders
You have elected representatives at different levels of government in your area.
The local authority in St. Helens looks after local services like council housing, waste collection and road maintenance.
Find out how to work with your elected representatives by using WriteToThem.
It's an independent website with no government affiliation and you can use it to write to any of your representatives, from your councillors to your MPs.
WriteToThem


